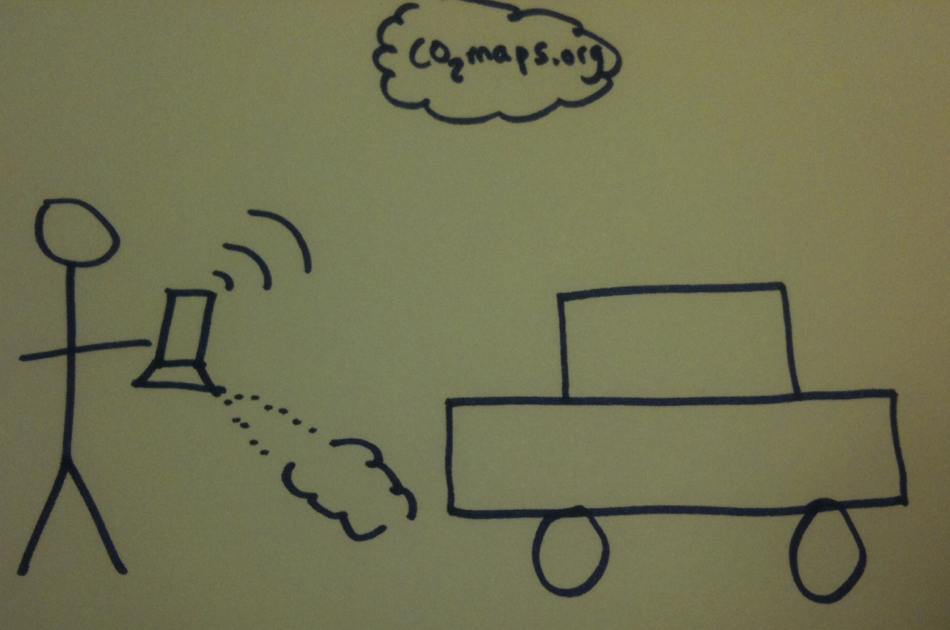
This is the project I presented at the Android+ADK Challenge at the Google Developer Day 2011 in Berlin. Although it wasn't accepted I want to show the main idea of the project. Send me some feedback if you like it :)
CO2maps.org: mapping the pollution of your streets
INTRODUCTION
Nowadays with more than 50% of the human population living on cities, the air pollution and the quality of lifes in the cities have decreased considerably. Taking into account the industries near the cities, the public and private transports, planes and power plants that involve burning of fossil fuels. The air pollution have become a real problems for cities such as Beijing, Ciudad de México, Los Ángeles or Barcelona and their citizens.
Gases like CO, SO2 and others are the main culpable of the warming climate. Goverments are taking measures to limit emissions of these gases through the Kyoto Protocol and applying taxes on carbon emissions and fuels. However, the gas emissions have not decreased. Moreover, 2.4 million people die each year from causes directly attributable to air pollution. Asthma or cystic fibrosis are two of the diseases that pollution increases more.
For this reason, citizens have the right to know the most polluted areas of their city but also the less polluted areas to practise sports or walk with your child’s stroller. For example, in Barcelona there is a running area in one of the most polluted street in the city (Diagonal), so probably sport is not recommended during the daily traffic jams.
PURPOSE OF THE PRODUCT
The goals of the CO2maps (CO-to-maps) are:
- Map in real-time the air pollution of the city
- Share with your friends and neighbours the state of pollution of the city in order to decide where it is recommended to go for sports or walk
- Create social awareness of the reality of the air pollution of the city
To achieve these goals, CO2maps will offer an air pollution sensor which will be connected via USB to you Android device. The CO2maps application will gather the air pollution information and will pair the measurement sensed data with its location (latitude, longitude and altitude). This information will be send at theCO2maps.org servers which will publish the data in the website. The system also will read the government open data related with air pollution.
The website CO2maps.org would offer the real-time (or latest measurement) air pollution heat map of the “mapped” city (where people with the sensors have been) through the Google Maps and visualization tools. It will suggest the cleanest air routes for practising sports and walk with children. Also, the website CO2maps.org would open an API with the historical data in standard format (JSON or XML) of the air pollution of the cities.
People who will create this air pollution map all around the world, would get “points” and cacique titles to do it. Furthermore, the system will maintain the privacy of the users who would share the air pollutions during their walks, rides or commuting.
REQUIREMENTS
FUNCTIONAL REQUIREMENTS
- Gather the air pollution (Arduino) and the latitude, longitude and altitude (Android) every X minutes.
- Send the collected data via HTTP POST message to the co2maps.org API.
- If there is no Internet connection, the application would store locally the information. Once the application detects connectivity, this gathered data will be sent.
- Stores the posted data in the server.
- Visualizes the data in a map with attributes such as hour, position and type of gas or gases.
- Offers the captured data through a REST API.
TECHNICAL REQUIREMENTS
- Android Device with GPS and Internet connectivity
- Arduino ATmega2560
- Air pollution sensor [http://www.sparkfun.com/products/9403] or similar
PROJECT PLAN
With the main idea of using an agile programming methodology, this is a draft project plan with the milestones of the iterations (weekly):
- 1st of August - 15th of September: development of the co2maps.org website with the public API and the mapping system.
- 1st of September - 1st of October: development of the Arduino microcontroller assembling the air pollution sensors and developing the Arduino part.
- 1st of October - 1st of November: development of the Android + ADK application.
- 1st of November - 15th of November: testing and air pollution measurements of Munich, Barcelona and Berlin.
- 19th of November: presentation of the project co2maps.org at the GDD Berlin.
REFERENCES
- Visualization of Nike+ running in NYC http://popupcity.net/2011/08/mapping-new-york-citys-runnability/
- http://www.msnbc.msn.com/id/30476335/ns/us_news-environment/t/report-lists-worst-best-cities-air-quality/
- http://www.airnow.gov/
- http://uk-air.defra.gov.uk/
